1.3 Microscopy
Introduction
As previously discussed, it is believed that Robert Hooke was one of the first scientists to observe microbes when he did so in 1665. He published his illustrations and observations from a variety of objects viewed under a microscope in his book Micrographia. Hooke used a compound microscope, meaning it contained two sets of lenses for magnification: the ocular lens next to the eye and the objective lens next to the specimen or object. The magnification of a compound microscope is a product of the ocular and objective lens magnification. Thus, a microscope with an ocular magnification of 10x and an objective magnification of 50x would have a total magnification of 500x.
Antonie van Leeuwenhoek, often called the “Father of Microbiology,” was not a scientist by profession. He was a cloth merchant from Holland who supposedly became inspired by Mr. Hooke’s work, probably with the original intent to examine textiles to determine quality. Despite this intent, van Leeuwenhoek quickly started examining just about everything under the microscope and kept detailed notes about his samples and observations. Van Leeuwenhoek was using what is called a simple microscope, a microscope with just a single lens. Essentially, it is a magnifying glass. But the lenses he produced were such high quality that he received credit for discovering single-celled life forms.
The early pioneers of microscopy opened a window into the invisible world of microorganisms. But microscopy continued to advance in the centuries that followed. In 1830, Joseph Jackson Lister created an essentially modern light microscope. The 20th century saw the development of microscopes that leveraged nonvisible light, such as fluorescence microscopy, which uses an ultraviolet light source, and electron microscopy, which uses short-wavelength electron beams. These advances led to major improvements in magnification, resolution, and contrast. By comparison, the relatively rudimentary microscopes of van Leeuwenhoek and his contemporaries were far less powerful than even the most basic microscopes in use today. In this Topic, we will survey the broad range of modern microscopic technology and common applications for each type of microscope.
Unit 1, Topic 3 Learning Objectives
By the end of Unit 1, Topic 3, you will be able to:
- Identify and describe the parts of a brightfield microscope.
- Calculate the total magnification for a compound microscope.
- Describe the distinguishing features and typical uses for various types of light microscopes and electron microscopes.
- Describe the differences and similarities between immunohistochemistry and immunocytochemistry.
- Explain the advantages offered by electron microscopy over light microscopy.
| Unit 1, Topic 3—To Do List | Suggested Average Time to Complete (min) |
|---|---|
| Read, make summary notes, and complete the self-check questions for Unit 1, Topic 3 of TRU Cell and Molecular Biology. | 60 |
| Complete Learning Activity: Virtual Microscope. | 30 |
| Complete Learning Activity: Fluorescence Microscopy. | 20 |
| Complete Learning Activity: Investigating Subcellular Organization by Microscopy. | 10 |
Modern Microscopy: Light Microscopes
Many types of microscopes fall under the category of light microscopes, which use light to visualize images.
Examples of light microscopes include:
- Brightfield microscopes
- Darkfield microscopes
- Phase-contrast microscopes
- Differential interference contrast microscopes
- Fluorescence microscopes
- Confocal scanning laser microscopes
- Two-photon microscopes
These various types of light microscopes can complement each other when used in diagnostics and research.
Brightfield Microscopy
The brightfield microscope, perhaps the most commonly used type of microscope, is a compound microscope with two or more lenses that produce a dark image on a bright background. Some brightfield microscopes are monocular (having a single eyepiece), though newer brightfield microscopes are binocular (having two eyepieces), like the one shown in Figure 1; in either case, each eyepiece contains a lens called an ocular lens. The ocular lenses typically magnify images 10 times (10⨯). At the other end of the body tube is a set of objective lenses on a rotating nosepiece. The magnification of these objective lenses typically ranges from 4⨯ to 100⨯, with the magnification for each lens designated on the metal casing of the lens. The ocular and objective lenses work together to create a magnified image. The total magnification is the product of the ocular magnification times the objective magnification:
[latex]\text{total magnification} = \text{ocular magnification}\times\text{objective magnification}[/latex]
For example, if a 40⨯ objective lens is selected and the ocular lens is 10⨯, the total magnification would be
[latex]\text{total magnification} = (40\times)(10\times) = 400\times[/latex]
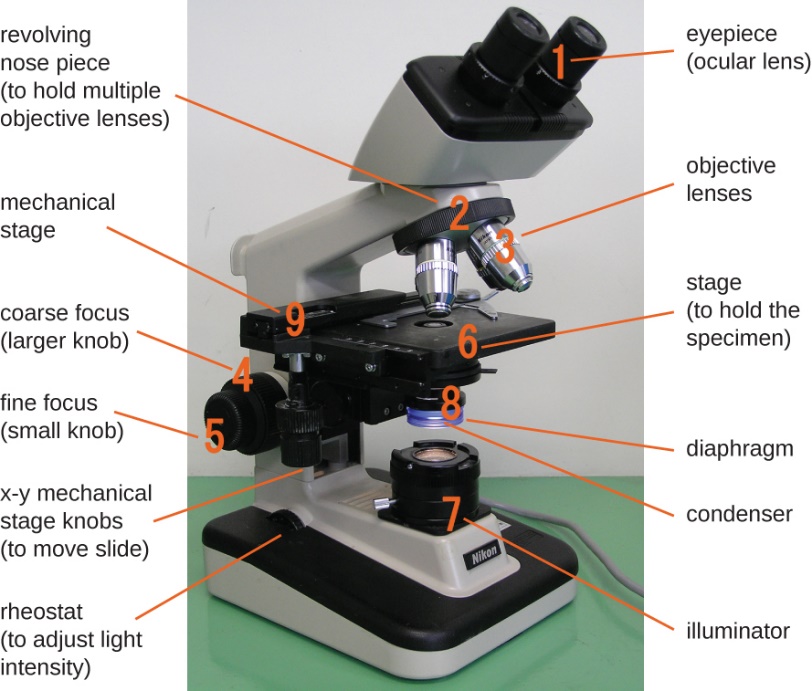
The item viewed using a microscope is called a specimen. The specimen is placed on a glass slide, which is clipped into place on the stage (platform) of the microscope. Once the slide is secured, the specimen on the slide is positioned over the light using the x-y mechanical stage knobs. These knobs move the slide on the surface of the stage but do not raise or lower the stage. Once the specimen is centred over the light, raising or lowering the stage position can focus the image. The coarse focusing knob is for large-scale movements with 4⨯ and 10⨯ objective lenses; the fine focusing knob is for small-scale movements, especially with 40⨯ or 100⨯ objective lenses.
The objective lenses have colour-coded bands:
- Yellow is 10x
- Red is 4x
- Blue is 40x
- White is 100x
Magnified images become dimmer because there is less light per unit area of the image. Highly magnified images produced by microscopes, therefore, require intense lighting. In a brightfield microscope, an illuminator, typically a high-intensity bulb below the stage, provides this light. Light from the illuminator passes up through the condenser lens (located below the stage), which focuses all of the light rays on the specimen to maximize illumination. The position of the condenser can be optimized using the attached condenser focus knob; once the optimal distance is established, the condenser should not be moved to adjust the brightness. If less-than-maximal light levels are needed, the amount of light striking the specimen can be easily adjusted by opening or closing a diaphragm between the condenser and the specimen. In some cases, brightness can also be adjusted using the rheostat, a dimmer switch that controls the intensity of the illuminator.
A brightfield microscope creates an image by directing light from the illuminator at the specimen; this light becomes differentially transmitted, absorbed, reflected, or refracted by different structures. Different colours can have different behaviours as they interact with chromophores (pigments that absorb and reflect particular wavelengths of light) in parts of the specimen. Chromophores are often artificially added to the specimen using stains that increase contrast and resolution. In general, structures in the specimen will appear darker, to various extents, than the bright background, creating maximally sharp images at magnifications up to about 1000⨯. This is where the term “brightfield” comes from. Further magnification would create a larger image but without increased resolution. This allows us to see objects as small as bacteria (only visible at about 400⨯ or so) but not smaller objects such as viruses.s.
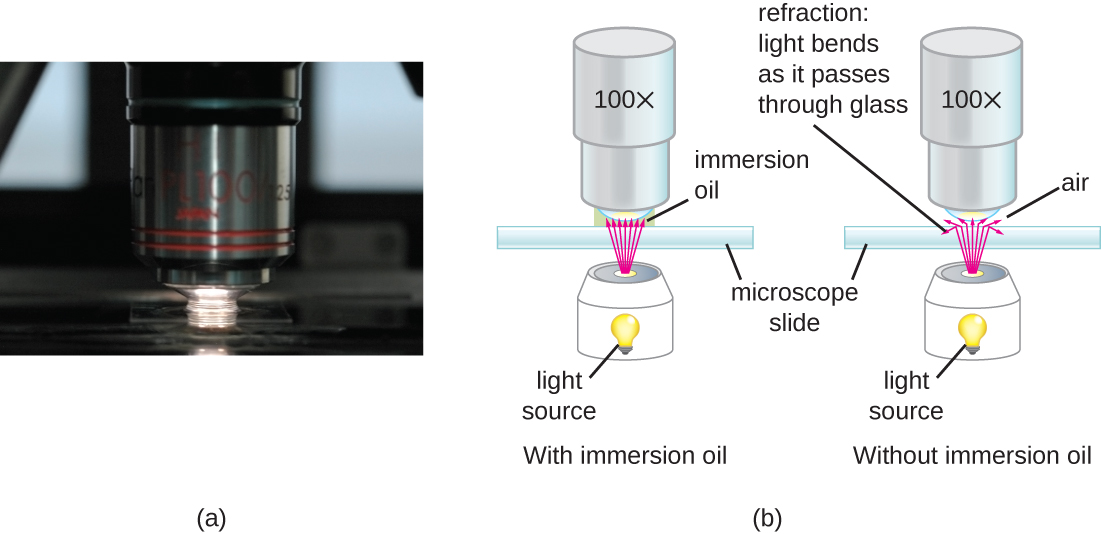
Light passing through the small amount of air between the specimen and the lens at very high magnifications may compromise the resolution. The reason is the large difference between the refractive indices of air and glass; the air scatters the light rays before the lens can focus them. Solving this problem can involve using a drop of oil to fill the space between the specimen and an oil immersion lens, a special lens designed for use with immersion oils. Since the oil has a refractive index very similar to that of glass, it increases the maximum angle at which light leaving the specimen can strike the lens. This increases the light collected and, thus, the image’s resolution (Figure 2). A variety of oils can be used for different types of light.
Learning Activity: Virtual Microscope
In this activity, you will explore a virtual microscope. This interactive allows you to take a self-guided tour of a compound microscope, explore its care and usage, and learn general information about the equipment and its components.
By the end of this activity, you should be able to:
- Identify the parts of a microscope.
- Understand common microscopy terminology.
- Calculate microscope magnification settings.
- Learn safe microscope operation.
- Watch the video Biology Lab Tutorial (7:54 min) by Tami Guy (2013) from ScienceProfOnline.com for a tutorial on how to use a compound light microscope.
- Go to the BrainPOP website and play through the Virtual Labs: Using the Microscope game by New Mexico State University (2020).
- Go to the Virtual Microscope by BioNetwork (2023). There are various activities allowing you to interact, explore and test your knowledge.
- Begin with the reference guide and scroll through all six sections (Introduction, Overview, Objective Lenses, Immersion Oil Lens, Microscope Care and Terminology); move next to “Learn and identify microscope parts.” Make sure to complete the quiz.
- Open the human folder, select simple columnar epithelium & find the villi. Can you find the microvilli?
- Open the human folder, select pseudostratified columnar epithelium & find cilia.
- Open the human folder, select BLOOD and focus on cell types.
Resolution
As can be seen, a modern microscope is a pretty technical tool, even one of the cheaper versions. Understanding a light microscope’s limitations requires understanding concepts like resolution, wavelength, and numerical aperture. The Abbé equation can sum up their relationship to one another:
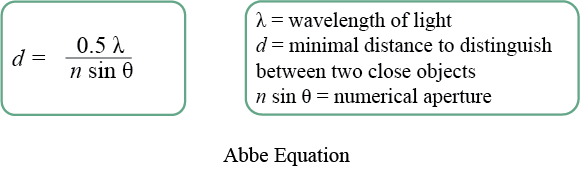
In microscopy, the definition of resolution is typically the ability of a lens to distinguish two objects that are close together. So, in the Abbé equation, d becomes the minimal distance where two objects next to one another can be resolved or distinguished as individual objects. Resolution depends on the wavelength of illumination used, where a shorter wavelength results in a smaller d. Lastly, there is the effect of the numerical aperture, which is a function of the objective lens and its ability to gather light. The numerical aperture value is defined by two components: n, which is the refractive index of the medium the lens is working in, and sin θ, which is a measurement of the cone of light that enters the objective.
A lens can typically work in two media: air, with a refractive index of 1.00, or oil, with a refractive index of 1.25. Oil allows for more light collection by directing more light rays into the objective lens. The maximum total magnification for a microscope using visual light for illumination is around 1,500X, where the microscope might have 15x oculars and a 100x oil immersion objective. The highest resolution possible is around 0.2 μm. Objects or cells closer together than this are indistinguishable as separate entities.
Here is a helpful description of resolution from Michael W. Davidson (2023) at Nikon’s MicroscopyU, including an interactive tutorial on numerical aperture and image resolution.
The type someone uses depends on the specific type of microbes/structures they want to visualize.
Magnification
Magnification is the process of enlarging the appearance of an object. Calculating the magnification of an object can be done by indicating the fold change in size. Therefore, if something appears as double the size of the actual item, it is obviously magnified 2X. Because there is a magnification by the eyepiece (ocular lens), as well as the objective lenses, the final magnification of an item is the product of those two lenses.
The lowest magnification objective lens (usually 4X or 5X) is a scanning lens. There is also usually a low power lens at 10X and a higher magnification lens at 40X. There may be a higher magnification lens at 100X, but these usually require oil to function properly.
Self-Check
What is the total magnification for each objective lens?
You can calculate it as:
[latex]\text{Total magnification} = \text{Objective magnification } \text{X} \text{ Ocular magnification}[/latex]
With this in mind, fill in the following table:
Field of View (FOV)
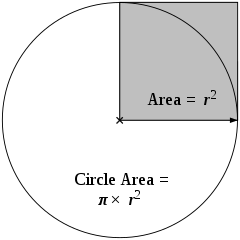
Viewing objects through a microscope often involves observing them within a circular space (or field), as defined by the lenses. This observable area is known as the field of view (FOV). Understanding the size of the FOV is important because calculating the actual sizes of objects can be done using the magnification of the lenses. FOV is similar to the area of a circle, Figure 3:
What are the effects of magnification on FOV? Compare the panels in Figure 4.


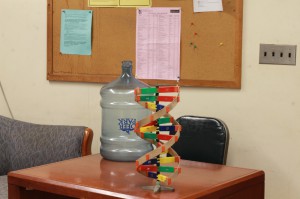

Figure 4: Left to right: (a) A model of DNA sits on a table with a water bottle in a large room. (b) The image displays less of the room in the background; however, the DNA model appears larger because of the greater magnification. (c) The door is no longer visible, and the DNA model is much larger. (d) The table the model and water bottle rest upon is no longer visible, and the water bottle and DNA model are larger still. While the last image is the largest, fewer surrounding objects are visible. There is higher magnification at the cost of field of view. FOV is inversely related to the magnification level. (OpenLab, n.d.) CC BY-NC-SA 3.0
Darkfield Microscopy
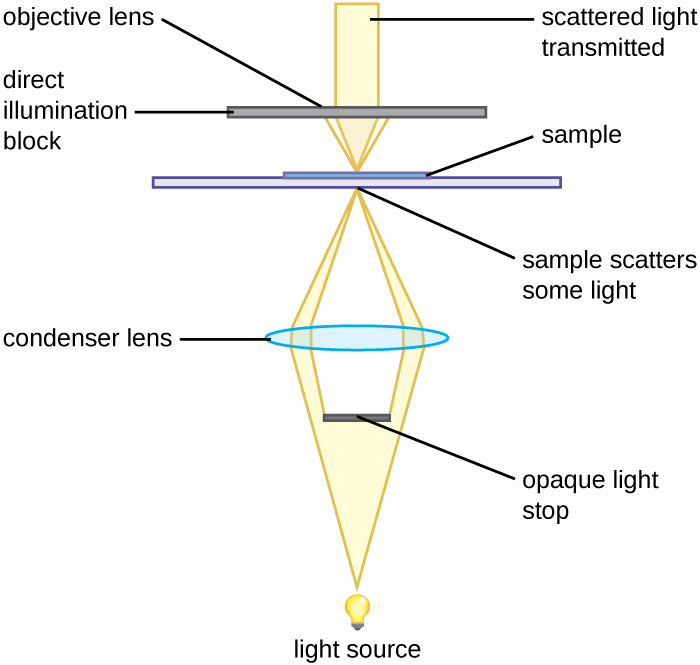
A darkfield microscope is a brightfield microscope with a small but significant modification to the condenser. This modification involves placing a small, opaque disk (about 1 cm in diameter) between the illuminator and the condenser lens. This opaque light stop, as the disk is called, blocks most of the light from the illuminator as it passes through the condenser on its way to the objective lens, producing a hollow cone of light focused on the specimen. The only light that reaches the objective is light that has been refracted or reflected by structures in the specimen. The resulting image typically shows bright objects on a dark background (Figure 5).
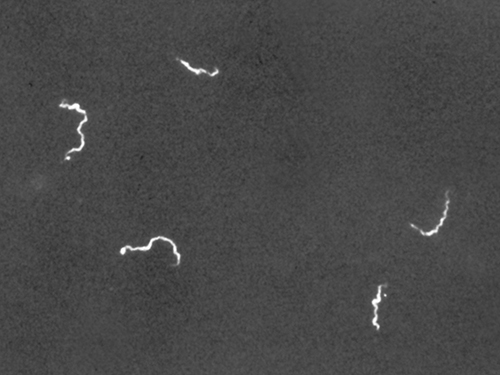
Darkfield microscopy can often create high-contrast, high-resolution images of specimens without using stains, which is particularly useful for viewing live specimens that staining may kill or otherwise compromise. For example, thin spirochetes like Treponema pallidum, the causative agent of syphilis, can be best viewed using a darkfield microscope (Figure 6).
Phase-Contrast Microscopes
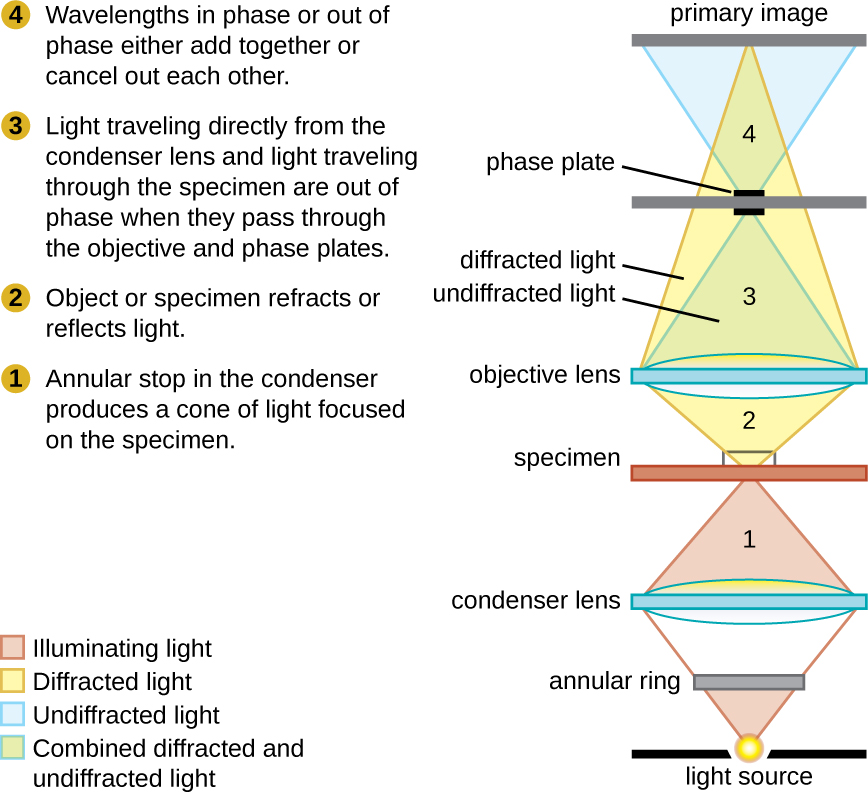
Phase-contrast microscopes use refraction and interference caused by structures in a specimen to create high-contrast, high-resolution images without staining. This microscope is the oldest and simplest microscope type that creates an image by altering the wavelengths of light rays passing through the specimen. Creating an altered wavelength path uses an annular stop in the condenser. The annular stop produces a hollow cone of light focused on the specimen before reaching the objective lens. The objective contains a phase plate containing a phase ring. As a result, light travelling directly from the illuminator passes through the phase ring while light refracted or reflected by the specimen passes through the plate. This causes waves travelling through the ring to be about one-half of a wavelength out of phase with those passing through the plate. Because waves have peaks and troughs, they can add together (if in phase together) or cancel each other out (if out of phase). When the wavelengths are out of phase, wave troughs will cancel out wave peaks, which is called destructive interference. Structures that refract light then appear dark against a bright background of only unrefracted light. More generally, structures that differ in features, such as refractive index, also differ in levels of darkness (Figure 7).
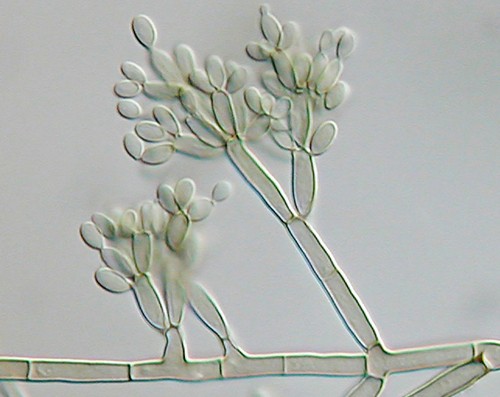
Because it increases contrast without requiring stains, phase-contrast microscopy is often used to observe live specimens. Certain structures, such as organelles in eukaryotic cells and endospores in prokaryotic cells, are especially well visualized with phase-contrast microscopy (Figure 8).
Differential Interference Contrast (DIC) Microscope
The differential interference contrast microscope operates on much the same principle as the phase-contrast microscope by taking advantage of the differences in the refractive index of a specimen and its surroundings. But it uses polarized light that is then split into two beams by a prism. One beam of light passes through the specimen, while the other passes through the surrounding area. When a second prism combines the beams, they “interfere” with one another due to being out of phase. The resulting images have an almost 3D effect, useful for observing living, unstained cells (Figure 9).
Self-Check
What are some advantages of phase-contrast and DIC microscopy?
Show/Hide answer.
A live specimen can be observed. This gets around the distortion problem resulting from using strong chemicals in fixation and staining.
Fluorescence Microscopy
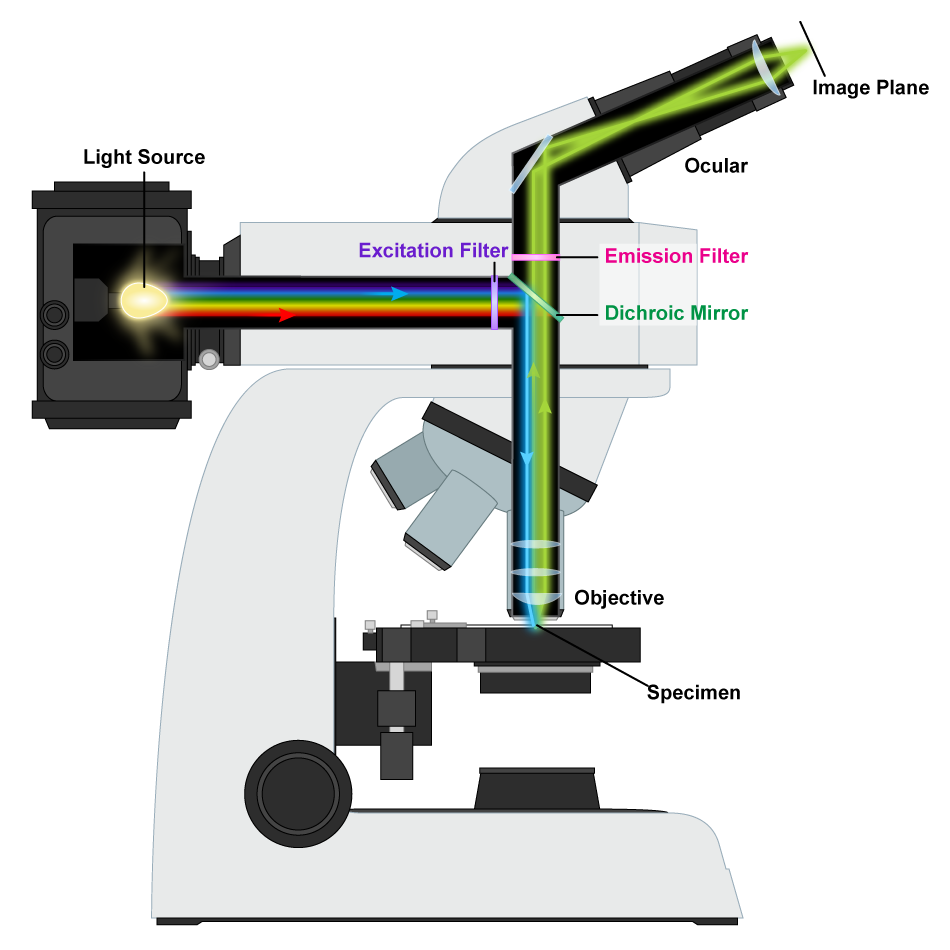
A fluorescence microscope utilizes the light emitted from a specimen rather than passing the light through it (Figure 10). A mercury-arc lamp generates an intense beam of light that is filtered to produce a specific wavelength of light directed at the specimen using a dichromatic mirror, which reflects short wavelengths and transmits longer wavelengths. Naturally, fluorescent organisms absorb the short wavelengths and emit fluorescent light with a longer wavelength that passes through the dichromatic mirror and can be visualized. There are a variety of microbes with natural fluorescence, but there are certainly far more organisms that lack this quality. Visualization of the latter organisms depends on the use of fluorochromes, fluorescent dyes that bind to specific cell components. The fluorochromes can also be attached to antibodies to highlight specific structures or areas of the cell or even different organisms.
Fluorochromes (fluorophores) are fluorescent chemical compounds capable of absorbing energy from a light source and then re-emitting this energy as visible light (longer wavelength with reduced energy). Fluorochromes include stains (dyes) added to the specimen to create contrast. Dyes such as Texas red and fluorescein isothiocyanate (FITC) are examples of fluorochromes (Figure 11). Other examples include the nucleic acid dyes 4′,6-diamidino-2-phenylindole (DAPI) (Figure 11a), Hoechst stain (Figure 11b), and acridine orange.
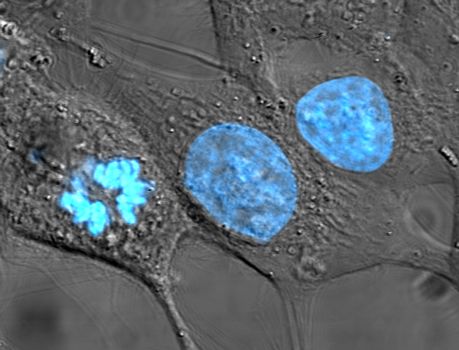
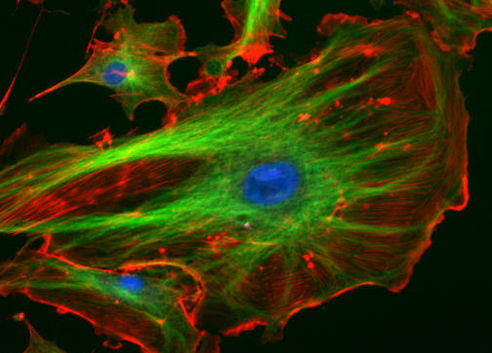
Figure 11: Fluorescent dyes. (Left) Cultured HeLa cells have been stained with Hoechst, turning their nuclei blue. (Right) The fluorescent dyes absorbed by these bovine pulmonary artery endothelial cells emit brilliant colours when excited by ultraviolet light under a fluorescence microscope. Various cell structures absorb different dyes. The nuclei are stained blue with DAPI; microtubules are marked green by an antibody bound to FITC; and actin filaments are labelled red with phalloidin bound to tetramethylrhodamine (TRITC). Credits: Right: image by National Institutes of Health; Left: (TenOfAllTrades/English Wikipedia) Public Domain.
The microscope transmits an excitation light, generally a form of electromagnetic radiation (EMR) with a short wavelength, such as ultraviolet or blue light, toward the specimen; the fluorophores absorb the excitation light and emit visible light with longer wavelengths. The excitation light is then filtered out (partly because ultraviolet light harms the eyes) so that only visible light passes through the ocular lens. This produces an image of the specimen in bright colours against a dark background.
Fluorescence microscopes are especially useful in clinical microbiology and cellular biology. They can be used to identify pathogens, to find particular species within an environment, or to find the locations of particular molecules and structures within a cell. Scientists have developed approaches to distinguish living from dead cells using fluorescence microscopy based on whether they take up particular fluorochromes. Sometimes, multiple fluorochromes are used on the same specimen to show different structures or features.
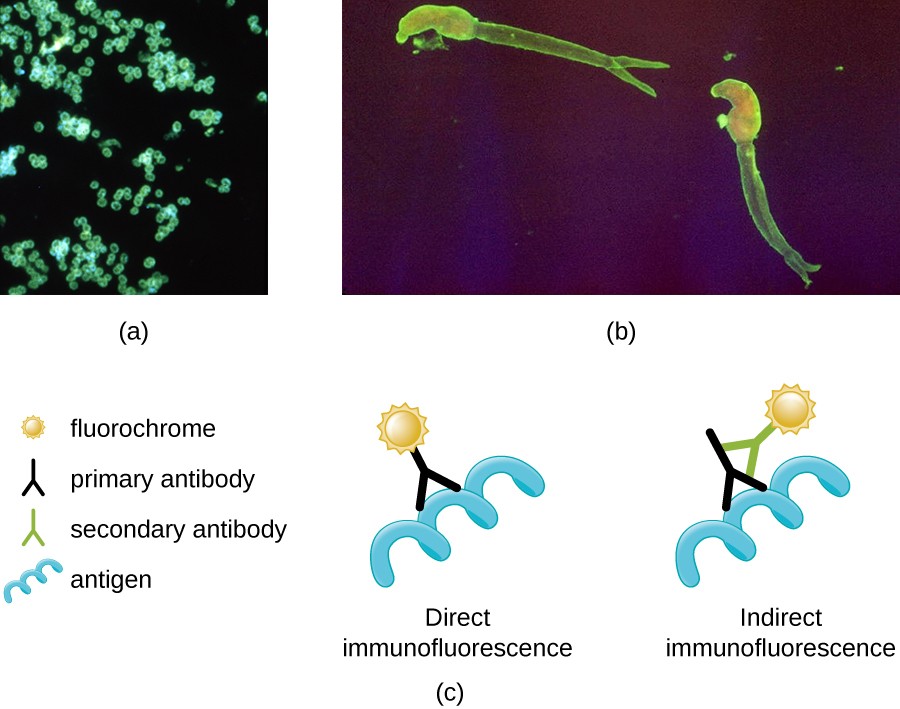
One of the most important applications of fluorescence microscopy is the technique of immunofluorescence, which can identify certain disease-causing microbes by observing whether antibodies bind to them. Antibodies are protein molecules the immune system produces that attach to specific pathogens to kill or inhibit them. There are two approaches to this technique: direct immunofluorescence assay (DFA) and indirect immunofluorescence assay (IFA) (Figure 12). In DFA, specific antibodies (e.g., those that target the rabies virus) attach to a fluorochrome. If the specimen contains the targeted pathogen, one can observe the antibodies binding to the pathogen under the fluorescent microscope. This is known as a primary antibody stain because the antibodies attached to the fluorochrome bind directly to the pathogen.
In IFA, secondary antibodies attach to a fluorochrome rather than primary antibodies. Secondary antibodies do not attach directly to the pathogen. Instead, they bind to primary antibodies. When the unstained primary antibodies bind to the pathogen, the fluorescent secondary antibodies can be observed binding to the primary antibodies. Thus, the secondary antibodies are attached indirectly to the pathogen. Since multiple secondary antibodies can often attach to a primary antibody, IFA increases the number of fluorescent antibodies attached to the specimen, making it easier to visualize its features (Figure 12).
This process is known as immunohistochemistry (IHC) when it involves the process of selectively identifying antigens (usually small regions of proteins or glycoproteins) in cells of a tissue section by exploiting the principle of antibodies binding specifically to antigens in biological tissues. The name of the process comes from the roots “immuno,” in reference to antibodies used in the procedure, and “histo,” meaning tissue.
On the other hand, immunocytochemistry (ICC) is another valuable form of immunostaining. It is similar to IHC, except it strips away the extracellular matrix material, and the cell membrane is etched with alcohol to make it permeable to antibodies. This allows antibodies to pass through the cell membrane and bind to specific targets inside the cell. This type of immunostaining can visualize organelles, cytoskeletal components, and other intracellular structures.
Self-Check
Why must a fluorophore be used to examine a specimen under a fluorescence microscope?
Show/Hide answer.
A fluorescence microscope uses fluorochromes/fluorophores, which can absorb energy from a light source and then emit this energy as visible light that is detected.
Learning Activity: Fluorescence Microscopy
The basic concept in fluorescence microscopy is labelling a specimen with a fluorescent molecule or fluorophore. When illuminated with light of a specific wavelength, the fluorophore can be excited and subsequently emits light of a longer wavelength. A CCD detects this emitted light and captures the image.
- Watch the following videos:
- Watch the simple animated diagram of a fluorescence microscope “1. Excitation & Emission” (0.12 min) by Animation Lab (2020).
- Watch the video “Fluorescence Microscopy” (5:41 min) by LabXChange (2020), where Erin Diel, an imaging specialist at Harvard University, takes you into the lab to demonstrate the power of using fluorescence microscopy to study cell biology. She explains when to use fluorescence microscopy over regular light microscopy.
- Watch the video “Primary and Secondary Antibodies” (6:48 min) by Frank Lectures (2017) to understand the difference between indirect and direct immunofluorescence.
- Answer the following question:
- Describe the procedure you would choose to accurately visualize where your favourite protein is located within a whole cell by fluorescence microscopy. Make your own drawing using stains mentioned in Unit 1, Topic 3.
Show/Hide answer.
You can choose indirect immunocytochemistry so that your signal becomes amplified by the ability of multiple secondary antibodies to bind to a primary antibody. You can use a mouse primary antibody specific to your favourite protein and a fluorescently tagged rat secondary antibody (this needs to be raised in a host species other than a mouse so that it recognises the mouse antibody as foreign).
You would also require a second indirect staining using another primary antibody that binds to a known subcellular structure, such as an organelle or another known protein. For example, if you think your protein is near the outer mitochondrial membrane, you would choose a second primary antibody (made in rabbits this time) that recognises another protein, such as the translocase of the outer mitochondrial membrane (or TOM). You can make your second fluorescently tagged secondary antibody in a goat (this needs to be raised in a host species other than a rabbit so that it recognises the rabbit antibody as foreign and does not recognise the mouse primary antibody already used in the first staining).
This double-labelling procedure can reveal the subcellular location of my protein.
Electron Microscopy
The maximum theoretical resolution of images created by light microscopes is ultimately limited by the wavelengths of visible light. Most light microscopes can only magnify 1,000⨯, and a few can magnify up to 1,500⨯; however, this does not begin to approach the magnifying power of an electron microscope (EM), which uses short-wavelength electron beams rather than light to increase magnification and resolution.
Electrons, like electromagnetic radiation, can behave as waves, but with wavelengths of 0.005 nm, they can produce much better resolution than visible light. An EM can produce a sharp image magnified up to 100,000⨯. Thus, EMs can resolve subcellular structures and some molecular structures (e.g., single DNA strands); however, electron microscopy cannot be used on living material because of the methods needed to prepare the specimens. Another drawback of using electrons is that they must be contained in a vacuum, eliminating the possibility of working with live cells. There is also some concern that the extensive sample preparation might distort the specimen’s characteristics or cause artifacts to form.
As in light microscopy, samples must be fixed and processed before being viewed using a transmission electron microscope, although the reagents used differ from those used for light microscopy. Preserving the tissue is very important in this technique; it is crucial that the membranes of the cell organelles are preserved and not obscured by precipitates (insoluble deposits) formed during fixation. Glutaraldehyde, which fixes proteins, followed by osmium tetroxide, which fixes lipids, are the fixatives most often used. The fixed tissue is embedded in a very rigid resin, such as epoxy resin, which allows very thin sections to be cut on an ultramicrotome. “Ultrathin” EM sections, used for studying cell organelles, are typically around 70 nm thick (compared with the 5–50 µm thick sections typically used for light microscopy).
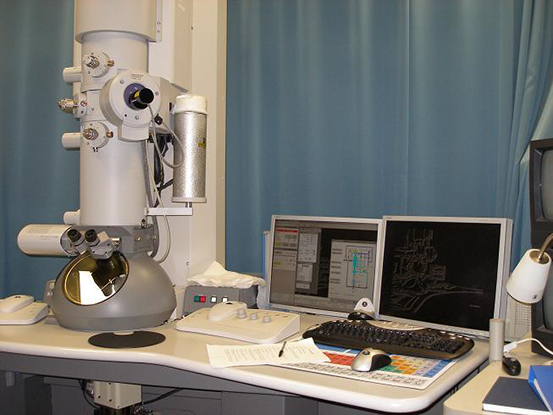
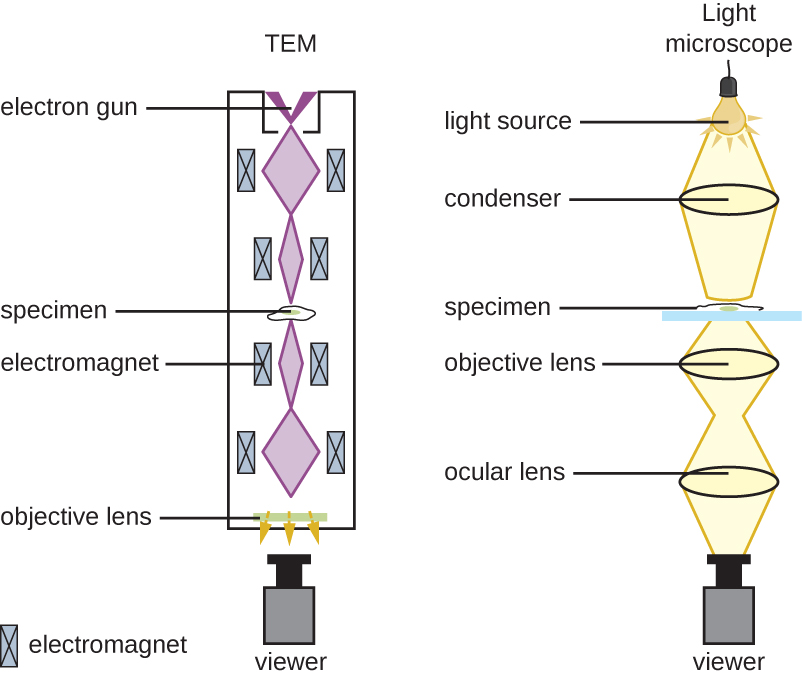
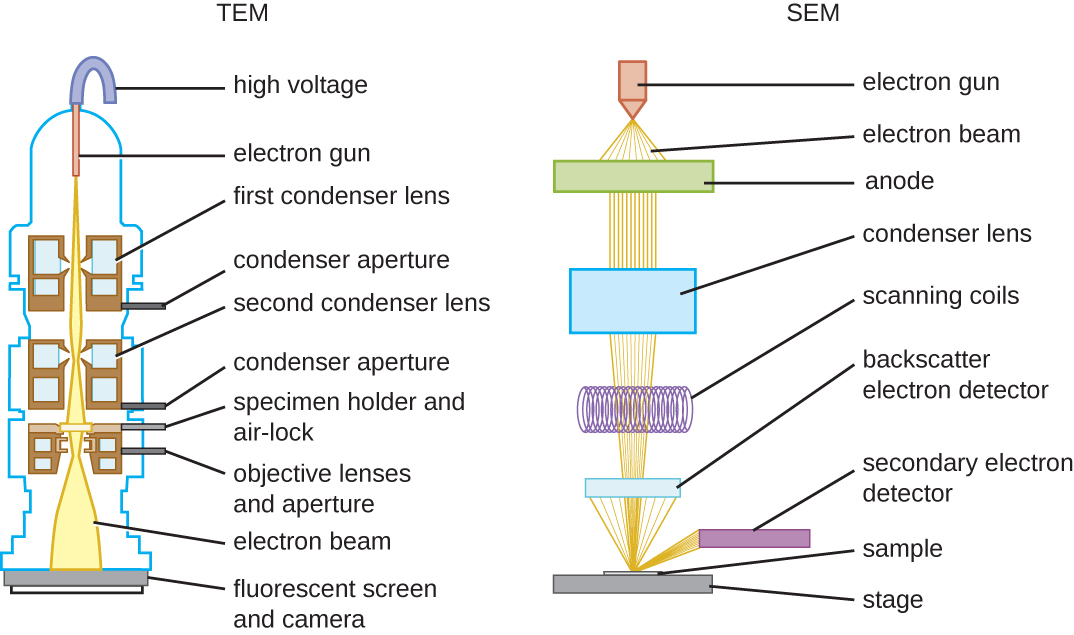
There are two basic types of EM: the transmission electron microscope (TEM) and the scanning electron microscope (SEM). Scanning and transmission electron microscopes are similar because they both use beams of electrons to produce an image, although different mechanisms form the final image. The TEM is somewhat analogous to the brightfield light microscope in terms of the way it functions. However, it uses an electron beam from above the specimen that is focused using a magnetic lens (rather than a glass lens) and projected through the specimen onto a detector. Electrons pass through the specimen, and the detector captures the image (Figure 13 and Figure 14). Obtaining this image involves focusing the electrons passing through the section on a fluorescent screen that emits visible light where electrons strike it. This resultant image is called an electron micrograph.
The transmission electron microscope is so named because an image forms from electrons transmitted through the examined specimen. For electrons to pass through the specimen in a TEM, the specimen must be extremely thin (20–100 nm thick). The image is produced because different parts of the specimen have different opacities. Staining the specimen with materials, such as heavy metals (which are electron-dense), can enhance this opacity. Electrons pass readily through unstained tissue sections because the cell components consist of small atoms, such as carbon, oxygen and hydrogen. Viewing cellular components, such as organelles, first involves “staining” the sections to increase contrast. However, unlike light microscopy, which uses coloured stains that absorb light, in TEM, the stains contain heavy metals, such as lead and uranium. These are large atoms that prevent electrons from passing straight through the section. Uranium binds preferentially to nucleic acids and proteins, while lead binds preferentially to lipids. So, after staining, cell components rich in lipids and areas with high protein and DNA concentrations prevent the passage of electrons and appear relatively dark (electron-dense) on the viewing screen. Areas with lower protein concentrations, such as the cytosol of animal cells, appear pale (electron-lucent). TEM requires that the beam and specimen be in a vacuum and that the specimen be very thin and dehydrated. When the beam hits the specimen, the sample scatters some electrons while others continue through unimpeded. In summary, the darker areas in the final image block the passage of electrons, while the lighter ones allow the transmission of more electrons.
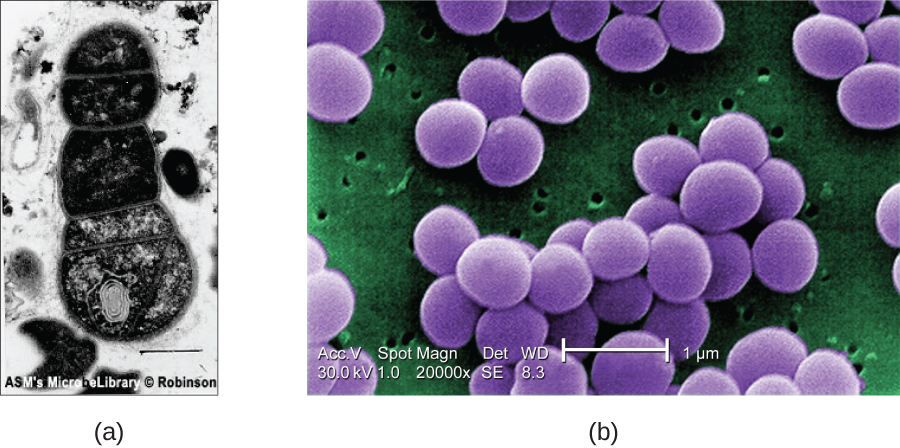
SEMs form images of surfaces of specimens, usually from electrons that are knocked off of specimens by a beam of electrons. This can create highly detailed images with a three-dimensional appearance displayed on a monitor (Figure 15). Therefore, this technique is used to study the surfaces of intact cells and tissues.Typically, specimens are dried and prepared with fixatives that reduce artifacts, such as shrivelling, that can occur when drying before being sputter-coated with a thin layer of metal, such as gold. The coating of the sample with a thin metallic layer deflects the electron beams onto a detector.
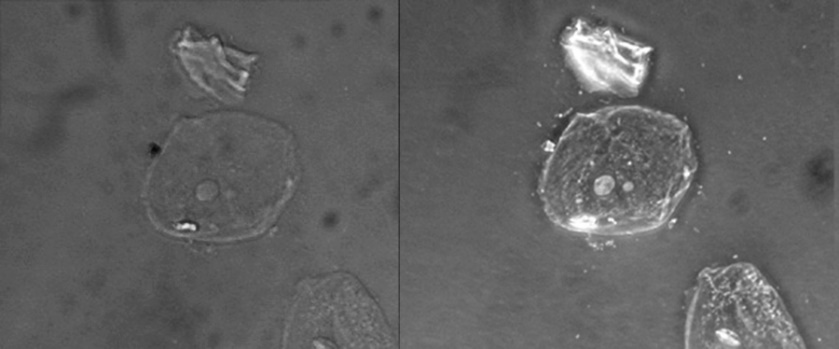
Whereas transmission electron microscopy requires very thin sections and allows one to see internal structures such as organelles, the interior of membranes and even molecules, scanning electron microscopy can be used to view the surfaces of larger objects (such as a pollen grain) as well as the surfaces of very small samples (Figure 16). Some EMs can magnify an image up to 2,000,000⨯.
To see some beautiful TEM and SEM photomicrographs, check out Dennis Kunkel’s site. Most have been colourized, but they are quite stunning.
Immunoelectron Microscopy
Immunolabelling to localise specific molecules to particular cell organelles can also be applied in electron microscopy. EM immunolabelling (often known as immunoelectron microscopy or immuno-EM) tags the antibody molecules with electron-dense substances, the most effective being small gold particles, observed as dark dots using the microscope. Different antibodies can be tagged with particles of different sizes, allowing the detection of more than one type of molecule simultaneously.
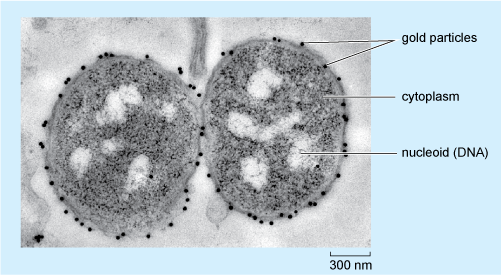
Figure 17 shows an example of how immunocytochemistry at the EM level can provide information about the localisation of molecules in an individual cell. The figure shows two bacterium cells, Neisseria meningitidis, labelled with an antibody that recognises a particular oligosaccharide (a short chain of sugar units). Visualizing the binding of this primary antibody uses a secondary antibody coupled to gold particles, 15 nm in diameter, each seen as a very dark (electron-dense) dot.
Self-Check
Looking at Figure 17, in which part of the bacterium is the oligosaccharide located?
Show/Hide answer.
It is located on the membrane because that’s where the gold particles attached to the secondary antibodies show up.
Learning Activity: Investigating Subcellular Organization by Microscopy
It is important to appreciate how subcellular organization is investigated and to recognise how an image was obtained in cell biology.
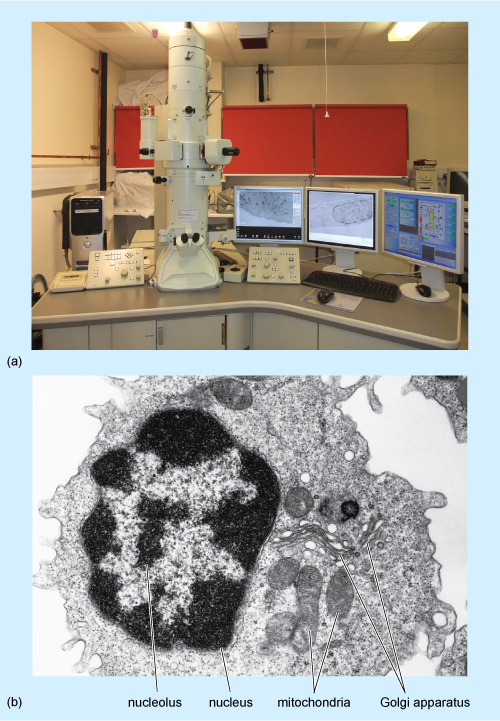
- Examine the image below (Figure 18). Write down as much as you can about how it was obtained, what the light and dark areas represent and the advantages of this type of microscopy over immunocytochemistry.
Show/Hide answer.
This image is an electron micrograph produced by shooting electrons at very thinly cut sections of a cell. Electron microscopes use magnets to focus electron beams, similar to light microscopes using lenses to focus light. Darker areas are denser and prevent electron transmission, while lighter areas are less dense and allow electron transmission. Electron microscopy has allowed the detailed examination of cellular ultrastructure and assisted in the identification and investigation of cell organelles such as the Golgi apparatus as well as molecules like DNA; these had previously been seen only as indistinct subcellular structures using immunochemical techniques and light microscopy. Disadvantages are that tissues and cells undergo extensive chemical processing, and live cells cannot be observed like some forms of light microscopy, such as phase contrast and DIC.
Key Concepts and Summary
- Numerous types of microscopes use various technologies to generate micrographs. Most are useful for a particular type of specimen or application.
- Light microscopy uses lenses to focus light on a specimen to produce an image. Commonly used light microscopes include brightfield, darkfield, phase-contrast, differential interference contrast, fluorescence, confocal, and two-photon microscopes.
- Some microscopy allows for viewing live images, which avoids distortion due to specimen processing.
- Subcellular organisation has been studied in two main ways: by electron microscopy (EM) and by the separation (fractionation) and subsequent biochemical or molecular analysis of the different cell components.
- Electron microscopy focuses electrons on the specimen using magnets, producing much greater magnification than light microscopy. The transmission electron microscope (TEM) and scanning electron microscope (SEM) are two common forms.
- In TEM, dense areas scatter the electrons, resulting in a dark area on the image, while electrons can pass (or “transmit”) through the less dense areas, resulting in a brighter section. The image is generated on a fluorescent screen and can then be captured.
- TEM requires very thin sections and allows one to see internal cellular structures such as organelles, the interior of membranes and even molecules like DNA.
- Immunoelectron microscopy allows the localisation of molecules to specific parts of cells.
- In SEM, electron beams are scattered from specimen surfaces to create a 3D view. Large and small objects can be observed.
- In TEM, dense areas scatter the electrons, resulting in a dark area on the image, while electrons can pass (or “transmit”) through the less dense areas, resulting in a brighter section. The image is generated on a fluorescent screen and can then be captured.
Long Descriptions
Figure 1 Image Description: Components of a typical brightfield microscope include an eyepiece (ocular lens), revolving nose piece (to hold multiple objective lenses), objective lenses, coarse focus (larger knob), fine focus (small knob), stage (to hold the specimen), illuminator, diaphragm, condenser, mechanical stage, x-y mechanical stage knobs (move to slide), and rheostat (to adjust light intensity). [Back to Figure 1]
Figure 5 Image Description: A darkfield microscope shines the light source into an opaque light stop (blocks most of the light) and then a condenser lens. The light reaches the sample, which scatters some light. Over the sample is a direct illumination block with the objective lens. Scattered light emerges from the top of the objective lens. [Back to Figure 5]
Figure 7 Image Description: Starting near the light source, the first phase difference occurs when the annular stop in the condenser produces a cone of light focused on the specimen. The second occurs when the object or specimen refracts or reflects the light. The third occurs when light travelling directly from the condenser lens and light travelling through the specimen are out of phase when they pass through the objective and phase plates. The final phase difference occurs when wavelengths in phase or out of phase either add together or cancel each other out. [Back to Figure 7]
Figure 10 Image Description: Fluorescence microscopes send the light from the source through an excitation filter. The light hits a dichroic mirror that reflects it down through the objective lens and into the specimen. The light hits the specimen and is sent back up the way it came, but this time, it passes through an emission filter. After that, it reflects off a mirror into the ocular lens and through the image plane. [Back to Figure 10]
Figure 15 Image Description: A TEM has the following components (starting at the top): high voltage, electron gun, first condenser lens, condenser aperture, second condenser lens, condenser aperture, specimen holder with air-lock, objective lenses and aperture, electron beam, and fluorescent screen and camera. A SEM has the following components (starting at the top): electron gun, electron beam, anode, condenser lens, scanning coils, backscatter electron detector, secondary electron detector, sample, and stage. [Back to Figure 15]
Media Attributions
- Figure 1: Figure 2.12 from OpenStax Microbiology (Parker et al.) is used under a CC BY-SA 4.0 license.
- Figure 2: Figure 2:13 from OpenStax Microbiology (Parker et al.) is used under a CC BY-SA 4.0 license.
- Figure 3: FOV: Area from City Tech Open Lab Biology OER (Seto 2018) is used under a CC BY-NC-SA 3.0 license.
- Figure 4: FOV: Magnification from City Tech Open Lab Biology OER (Seto 2018) is used under a CC BY-NC-SA 3.0 license.
- Figure 5: Figure 2.14. from OpenStax Microbiology (Parker et al. 2016) is used under a CC BY 4.0 license.
- Figure 6: Figure 2.15 by Centers for Disease Control and Prevention, from OpenStax Microbiology (Parker et al. 2016), is used under a CC BY 4.0 license.
- Figure 7: Figure 2.16 from OpenStax Microbiology (Parker et al. 2016) is used under a CC BY 4.0 license.
- Figure 8: Figure 2.17 from OpenStax Microbiology (Parker et al. 2016) is used under a CC BY 4.0 license.
- Figure 9: Figure 2.18 from OpenStax Microbiology (Parker et al. 2016) is used under a CC BY 4.0 license.
- Figure 10: Olympus-BX61-fluorescence microscope by Masur (2006), via Wikimedia Commons, is used under a GFDL, or CC BY-SA 3.0 license.
- Figure 11: (Right) FluorescentCells by National Institutes of Health (2006), via Wikimedia Commons, is in the public domain; (Left) HeLa cells stained with Hoechst 33258 by TenOfAllTrades (2007), via Wikimedia Commons, is in the public domain.
- Figure 12: Figure 2.19 [(a) and (b) modification of work by Centers for Disease Control and Prevention] from OpenStax Microbiology (Parker et al. 2016) is used under a CC BY 4.0 license.
- Figure 13: Figure 2.21 from OpenStax Microbiology (Parker et al. 2016) is used under a CC BY 4.0 license.
- Figure 14: Figure 2.22 from OpenStax Microbiology (Parker et al. 2016) is used under a CC BY 4.0 license.
- Figure 15: Figure 2.23 from OpenStax Microbiology (Parker et al. 2016) is used under a CC BY 4.0 license.
- Figure 16: Figure 2.24 [(a) and (b) modification of work by American Society for Microbiology] from OpenStax Microbiology (Parker et al. 2016) is used under a CC BY 4.0 license.
- Figure 17: Figure 3 by Heather Davies, Department of Life, Health and Chemical Sciences, Open University; from A tour of the cell: Immunoelectron microscopy used with permission from The Open University
- Figure 18: Figure 2 from A tour of the cell: Immunoelectron microscopy at The Open University is used under a CC BY-NC-SA 4.0 license. Figure 2b is used under license from Dr Gopal Murti/Science Photo Library.
References
Animation Lab. 1. Excitation and emission [Video]. Fluorescence Microscopy. LabXchange. 2020 Dec 9, 0:12 minutes. [modified 2023 Dec 13, accessed 2024 Jan 17]. https://www.labxchange.org/library/pathway/lx-pathway:d4fea502-5def-48e2-a1a7-bfb83ab30383/items/lb:LabXchange:853dc65b:video:1/80459?source=%2Flibrary%2Fclusters%2Flx-cluster%3Alxc-fox%3Fsource%3D%2Flibrary%2Fclusters%2Flx-cluster%3Alxc-fox%3Fsource%3D%2Flibrary%2Fclusters%2Flx-cluster%3AAPBio%3Fsource%3D%2Flibrary%2Fclusters%2Flx-cluster%3AAPBio.
BioNetwork. 2023. Virtual microscope [Interactive webpage]. Raleigh (NC): North Carolina Community College System; [accessed 2024 Jan 17]. https://www.ncbionetwork.org/iet/microscope/.
Davidson MW. 2024. Resolution [Blog]. MicroscopyU; [accessed 2024 Jan 17]. https://www.microscopyu.com/microscopy-basics/resolution.
Dennis Kunkel: stock microscopy images. 2017. London (England): Science Photo Library; [accessed 2024 Jan 17]. https://www.denniskunkel.com/.
Frank Lectures. Primary and secondary antibodies (FL-Immuno/69) [Video]. YouTube. 2017 Dec 12, 6:48. [accessed 2024 Jan 17]. https://www.youtube.com/watch?v=qQ0BaZ83ZtY.
LabXchange. How to: fluorescence microscopy [Video]. LabXchange. 2020 Jan 21, 5:41 minutes. [accessed 2024 Jan 17]. https://www.labxchange.org/library/items/lb:LabXchange:105e72d3:video:1.
Masur. 2006. Olympus-BX61-fluorescence microscope [Image]. Wikimedia Commons; [updated 2020 Sep 12; accessed 2024 Jan 17]. https://commons.wikimedia.org/wiki/File:Olympus-BX61-fluorescence_microscope.jpg.
National Institutes of Health. 2006. FluorescentCells [Image]. Wikimedia Commons; [updated 2022 Oct 6; accessed 2024 Jan 17]. https://commons.wikimedia.org/wiki/File:FluorescentCells.jpg.
New Mexico State University. 2020. Virtual labs: using the microscope [Interactive game]. New York (NY): BrainPOP; [accessed 2024 Jan 17]. https://www.brainpop.com/games/virtuallabsusingthemicroscope/.
Parker N. Schneegurt M, Thi Tu A-H, Lister P, Foster BM. 2016. Microbiology. Houston (TX): OpenStax; [accessed 2024 Jan 17]. Figures 2.12, 2.13, 2.14, 2.15, 2.16, 2.17, 2.18, 2.19 (a)(b), 2.21, 2.22, 2.23, 2.24 (a)(b). https://openstax.org/books/microbiology/pages/1-introduction.
Seto J. 2018. Field of view (FOV): area [diagram]. Brooklyn (NY): City Tech OpenLab. [accessed 2024 Jan 17]. https://openlab.citytech.cuny.edu/bio-oer/biology-basics/microscopy/2/
Seto J. 2018. Field of view (FOV): magnification [image series]. Brooklyn (NY): City Tech OpenLab. [accessed 2024 Jan 17]. https://openlab.citytech.cuny.edu/bio-oer/biology-basics/microscopy/2/
Tami Guy, MS, CPPS. How to use a compound light microscope: biology lab tutorial [Video]. YouTube. 2013 Jun 21, 7:54 minutes. [accessed 2024 Jan 17]. https://www.youtube.com/watch?v=lo2aC_m2vyo.
TenOfAllTrades. 2007. HeLa cells stained with Hoechst 33258 [Image]. Wikimedia Commons; [updated 2024 Jan 3; accessed 2024 Jan 17]. https://commons.wikimedia.org/w/index.php?title=File:HeLa_cells_stained_with_Hoechst_33258.jpg&direction=next&oldid=701102987.
